


Mastering Fraud Solution Implementation - It's Almost Never the Technology
10.07.2026
Picture this: 18 bank accounts, 4 fake identities, months of careful planning-and then boom. Maxed credit lines, vanished fraudsters, millions at risk. But this time, graph analytics saw it coming.
In a recent investigation, analysts stumbled upon something that looked almost too sophisticated to be real: a synthetic identity ring operating like a precision instrument. Four to five bank accounts per fake identity, all connected by shared phone numbers and strategically co-located addresses. The fraudsters played the long game, keeping accounts dormant, building credit histories, waiting for the perfect moment to strike.
When they finally made their move, it was devastating. Credit lines maxed out in coordination, funds transferred in a carefully orchestrated dance, and then... silence. The digital ghosts vanished as quickly as they appeared.
What caught them? Not traditional fraud rules. Not machine learning models. Graph analytics.
The very connections they thought would hide them; shared phone numbers, linked addresses, coordinated timing became the threads that unraveled their entire operation. [Ref1]
Most fraud detection treats each transaction, each account, or each application as an isolated event. It's like trying to understand a complex conversation by reading individual words scattered across different pages - you're missing the context, the relationships, and the overall story.
The fundamental flaw in this approach is that fraudsters don't operate in isolation; they operate in networks.
The reason for this is simple and strategic: fraudsters are incentivized to share resources to scale their operations, reduce costs, and evade detection. They leverage connections to make their schemes more efficient and difficult to trace. This inherent need for collaboration and shared resources is what creates the network structures that traditional systems fail to see.
Think of it this way:
Money mules don't operate alone; they are recruited to create layered payment chains that obscure the final destination of funds.
Synthetic identity rings don't create unique, isolated fake personas. They share and reuse PII (Personally Identifiable Information) components like phone numbers or addresses to build multiple fake identities at scale.
Bust-out schemes rely on coordinating across multiple accounts to maximize credit lines and then vanish simultaneously.
Device farms create false digital footprints by linking many accounts to a small number of devices.
Traditional approaches miss these powerful connections because they are designed to look at individual data points. Graph analytics, however, is purpose-built to make these networks and the relationships within them visible, exposing the true nature of the fraud.
Understanding graph fraud detection starts with a key distinction that's often overlooked - the difference between graph visualization and graph analytics. Both are powerful, but they serve fundamentally different purposes in the fight against fraud.
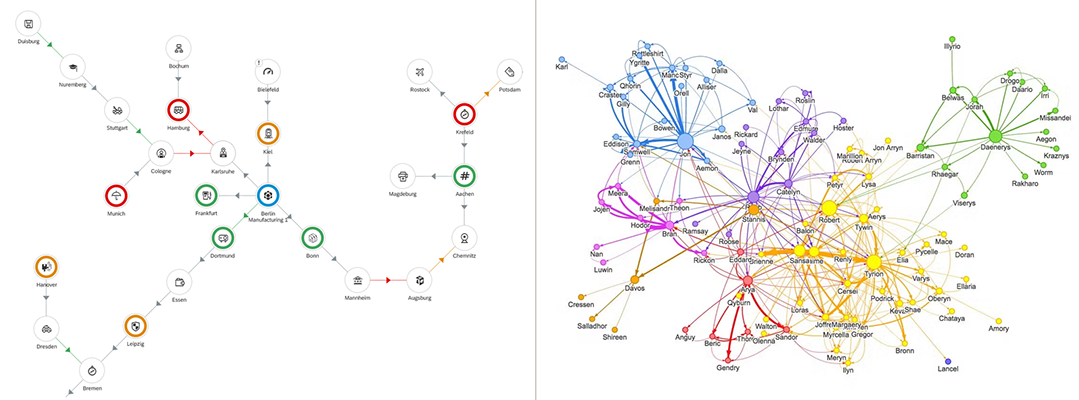
Graph visualization is about making the invisible connections visible. It shows relationships between entities like accounts, devices, email addresses, phone numbers, linked by shared attributes. When two customers use the same mobile number or share an email address, visualization maps these connections as a network of nodes and edges.
Think of this as fraud CSI. An investigator can see at a glance how seemingly unrelated accounts connect through shared phone numbers, devices, or addresses. It's invaluable for investigations, audits, and understanding the structure of fraud rings after they've been detected.
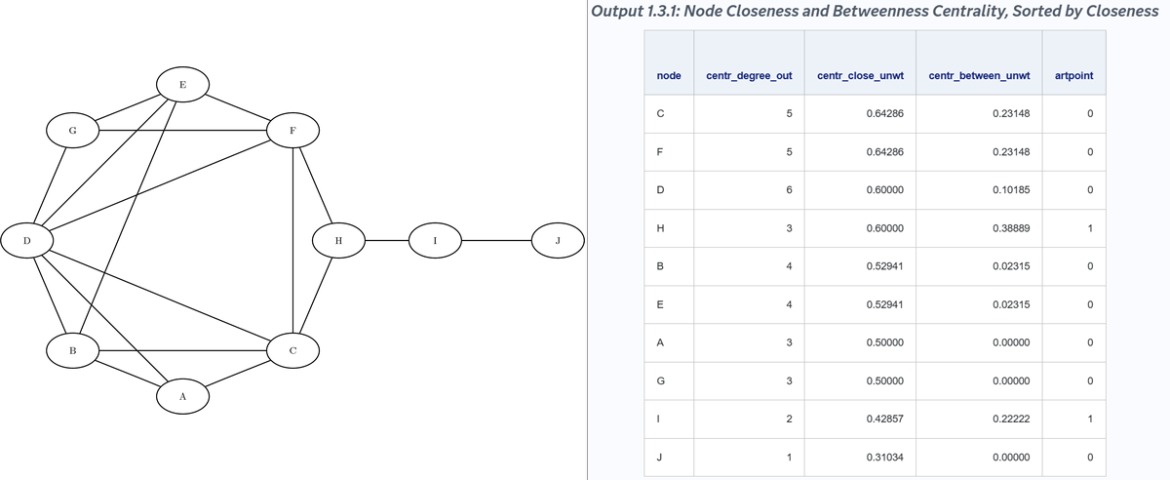
Graph analytics goes deeper - it uses algorithms and mathematical calculations to derive meaningful metrics from the network structure. While visualization shows what is connected, analytics reveals how significant those connections are.
Consider these powerful metrics:
Real-world impact: China's UnionPay, the world's largest payment card provider, leverages both visualization and analytics at scale, using centrality metrics derived from transactional data to catch fraud in real-time. This isn't just theory - these mathematical approaches are deployed in production systems processing millions of transactions daily. [Ref2]
Before the first transaction, before the first credit line, graph analytics can spot the warning signs. Shared phone numbers, recycled addresses, and similar application patterns create telltale network signatures.
In documented case studies, synthetic applications were blocked when graph logic surfaced links via shared phone numbers and addresses to known fake IDs. Integration of these network-derived features reduced risky onboarding approvals by significant percentages.
When fraudsters apply for consumer loans, they often recycle personal details across multiple applications. Graph analytics excels at detecting these patterns by comparing the extent and authenticity of information provided across different customer applications.
The fraud signature: Multiple loan applications sharing phone numbers, employment details, or reference contacts, but with slight variations in names or addresses. A legitimate customer provides consistent, verifiable information. Fraudsters create networks of interconnected applications with shared elements that seem coincidental individually but reveal coordination when viewed as a graph.
Graph analytics can instantly flag when an applicant's phone number appears across multiple applications, when employment verification details match previous fraudulent attempts, or when character references link to known fraud rings.
Insurance claim fraud often involves multiple entities: claimants, medical providers, repair shops, or witnesses working in coordination. Graph analytics transforms claim investigation by mapping relationships between these entities across historical claims.
Example scenario: A staged accident claim might involve a claimant, a specific medical clinic, a particular attorney, and a preferred repair shop. Individually, each relationship appears normal. But when graph analytics reveals that the same combination of entities appears across multiple claims, patterns emerge:
By cross-referencing entities captured in claims data, graph analytics can predict fraudulent claims before payouts occur, identifying rings that traditional claim-by-claim analysis would miss entirely.
Consider how a major European bank revolutionized its transaction monitoring by thinking in networks rather than individual transactions. Traditional systems flagged transactions based on amount, frequency, or merchant type, resulting in thousands of false positives daily due to legitimate customers triggering generic rules.
The graph approach changed everything.
Instead of analyzing each transaction in isolation, the bank built a network connecting customers through shared merchants, transaction patterns, and timing relationships. They then applied a powerful graph metric:
Shortest Path Analysis: This measures how "close" any customer is to known fraudsters in the transaction network. A legitimate customer might occasionally shop at the same merchant as a fraudster, that's normal. But when graph analysis reveals that a customer is consistently just 2-3 transaction hops away from multiple known fraud accounts, that's a red flag.
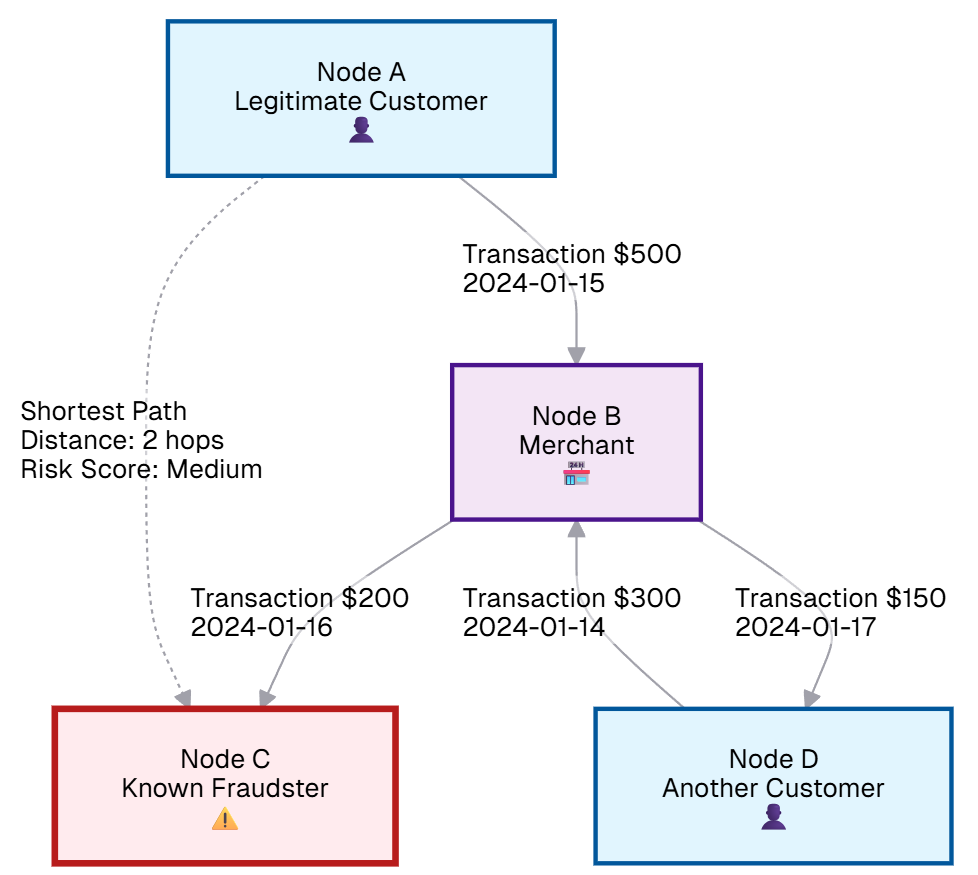
Real example: Customer A sends money to Merchant B, who immediately transfers funds to Customer C (a known money mule). Traditional systems see these as separate, unrelated transactions. Graph analysis reveals Customer A is just two steps away from criminal activity; the shortest path through the network exposes the connection.
The results were promising: when combined with other graph features and traditional methods, the overall system achieved AUC scores of 0.888 with reduced false positives. The shortest path analysis contributed valuable explainability; investigators could now say "flagged due to proximity to known fraud accounts" rather than relying solely on generic transaction-based rules.
Graph analytics excels at exposing massive money-mule rings by linking accounts across devices, phones, and transaction networks, even when each account individually appears low-risk.
Recent law enforcement operations disrupted mule networks involving nearly 10,000 recruited mules and approximately $100M in funds by tracing patterns across multiple platforms. The key breakthrough came from network analysis that revealed coordination invisible to traditional detection methods.
Here's a counterintuitive truth: graph analytics gets exponentially better with more data. Not just more transactions, but more data types, more institutions, more context.
Fraud detection platforms operating in large-scale payment ecosystems or national consortia provide breadth, creating richer, more comprehensive graphs. National fraud exchange initiatives applying graph AI across settlement data have demonstrated remarkable improvements [Ref3]:
The lesson? Fragmented data equals fragmented protection. Comprehensive data enables comprehensive defense.
Let's address the elephant in the room. Graph analytics isn't plug-and-play magic. Real challenges dominate the implementation landscape:
Exact vs. Fuzzy Matching: While exact matches (same phone number, identical email) create obvious connections, the real power comes from fuzzy matching capabilities. Consider these scenarios:
Advanced fuzzy matching algorithms can identify these variations, but they require careful tuning. Too strict, and you miss genuine connections. Too loose, and you create false relationships that pollute your graph.
Data quality has a multiplier effect on graph value - both positive and negative.
Poor data quality destroys graph effectiveness:
High-quality data amplifies graph power:
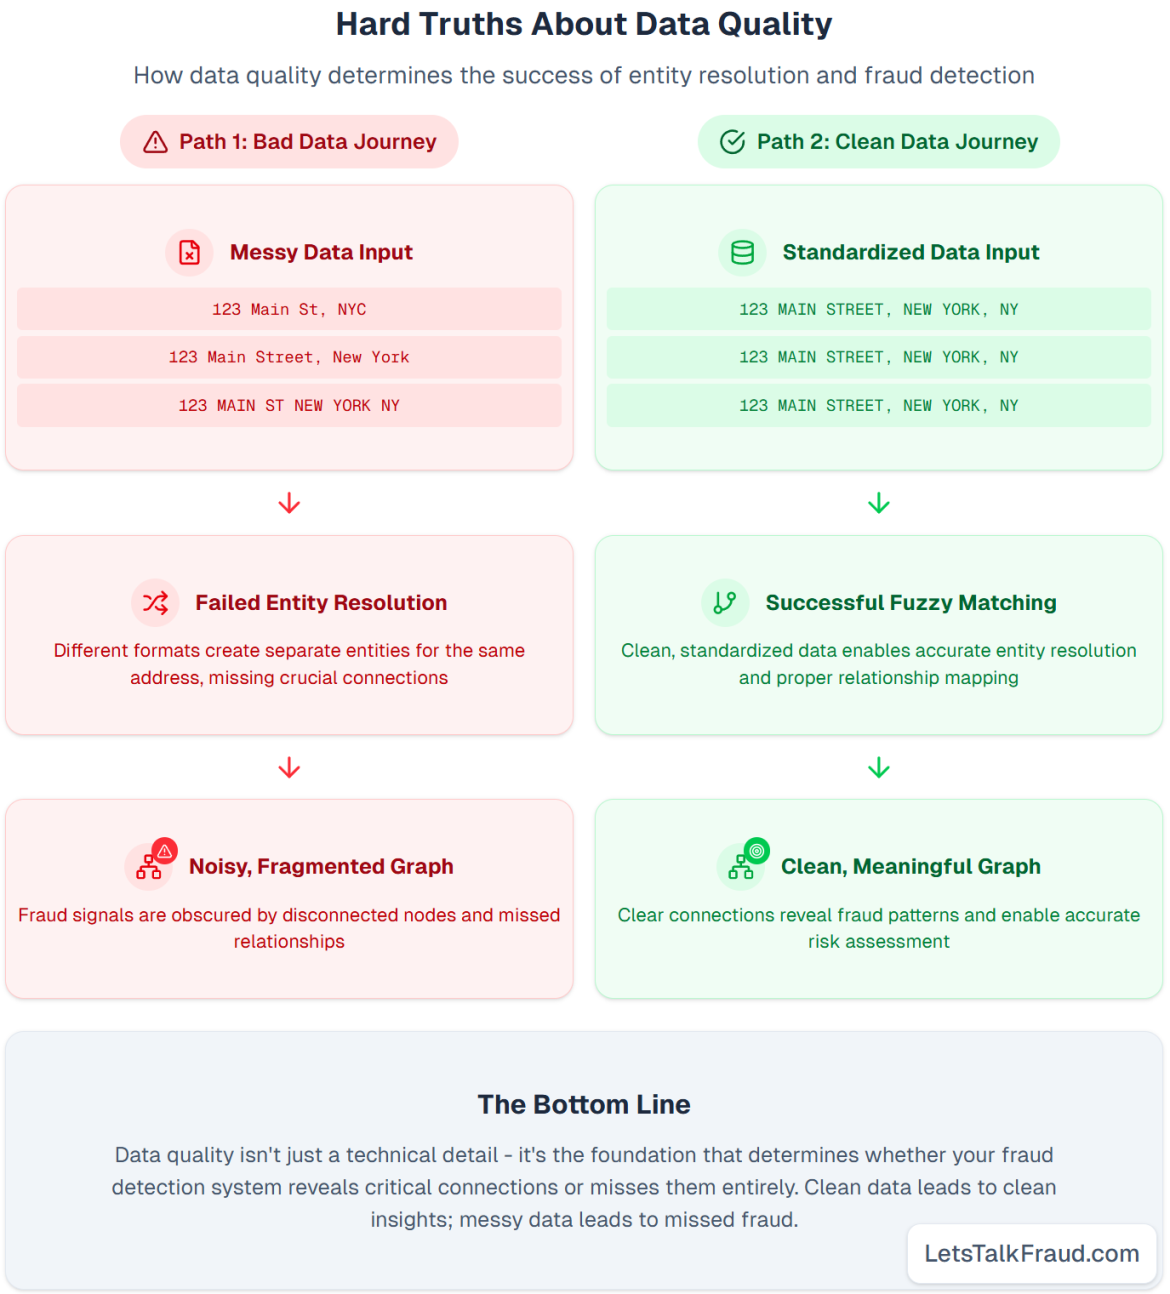
Real-world impact: A single missing digit in a phone number can break the thread connecting a money mule to their controller. Conversely, incorrectly linking customers who happened to use the same public Wi-Fi creates massive noise clusters that obscure genuine fraud signals.
Over-broad linking destroys the signal. Connect too many nodes through weak relationships (same ISP, café Wi-Fi) and your graph becomes noise. Literature consistently warns against over-linking and emphasizes tuning rule thresholds with business-informed filtering.
Solution: Leading institutions deploy explainable graph models that not only detect fraud but explain the reasoning - crucial for investigator confidence and regulatory compliance. These systems prevent false positives while maintaining interpretability for fraud investigators.
The next evolution combines graph-derived features with advanced machine learning. Recent research introduced systems like detectGNN - graph neural networks modeling dynamic behavior across accounts, devices, and merchants, achieving higher accuracy than traditional methods while enabling real-time scoring. [Ref4]
Real-world results: Hybrid approaches combining graph features with traditional tabular models have improved fraud recall by approximately 18% in production deployments while providing superior explainability - "flagged as fraud because linked to known suspects."
This represents the future of fraud detection: systems that don't just catch fraud but explain their reasoning in terms humans can understand and act upon.
Phase 1: Data Foundation
Phase 2: Proof of Concept
Phase 3: Scale and Integrate - Once value is demonstrated, enterprise graph platforms can integrate with cloud infrastructure and existing fraud pipelines to support real-time scoring and investigation workflows.
Remember: Start with data quality, prove value through prototyping, scale intelligently.
Fraud isn't flat, it's networked, contextual, and coordinated. Quality detection depends on gathering contextual information before the transaction assessment step, evaluating it through various techniques, including business rules and AI/ML models.
Graph analytics provides what no other technique can: the ability to see fraud as fraudsters see it as a connected, coordinated operation.
Graph analytics infuses critical context into both detection and alert triage processes, connecting scattered signals into meaningful intelligence. Whether you're a central bank protecting national payment systems, a consortium sharing threat intelligence, or a single institution defending customers, clever graph design and linking delivers clarity, context, and actionable intelligence.
Fraud is connected and contextual. Graph analytics adds the layer of context needed to boost detection, improve triage, and uncover what rules and ML on their own simply cannot see.
Ready to get started? Your first step is to audit your data quality and prove the value of graph analytics with a small-scale proof of concept. The journey from hype to reality starts here.
[Ref1] Neo4j Blog - Financial fraud detection with graph data science approaches
[Ref2] FC16 Financial Cryptography Conference - Graph analytics in payment fraud detection at scale
[Ref3] Cambridge SupTech Lab - Countering consumer fraud with national fraud portals and graph AI
[Ref4] arXiv:2503.22681 - detectGNN: Dynamic graph neural networks for real-time fraud detection


