How (not) to train the fraud detection model! (Part 1)
Milo's first fraud model shows why reliable fraud labels, relevant data and a focused fraud typology matter before adding more features.
 By Ivan Skula
November 6, 2022
By Ivan Skula
November 6, 2022
A data scientist – let's call him Milo – is tasked with building a predictive model for fraud detection. And though he is not very familiar with the fraud domain and isn't a seasoned data scientist, he likes the idea of learning something new, so he jumps on to the task immediately.
He dives into the data warehouse (DWH) and locates the table with recent and historical transactions. He pulls the last six months of data into his development area and designates this table as his initial Analytical Base Table (ABT). He uses this dataset to train and validate his predictive model.
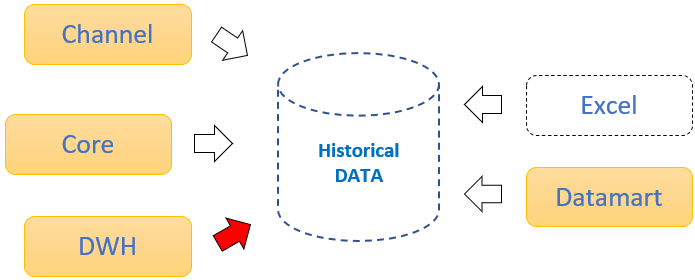
But at this point, it's still missing one critical detail – an indicator of fraud. If we want the model to spot scams among genuine transactions, we must first be able to distinguish them (flag them as fraud or non-fraud). How else would the model be able to differentiate between the indicators of "good" and "bad" transactions, right? Unfortunately, Milo doesn't know where such information might be stored in the DWH (or whether it is even there), nor is he aware of any specific data mart that holds it. Therefore, he needs to reach out to his colleagues in the Fraud Risk department. Milo sees them immediately and asks whether they have six months of fraud history, and they respond with an approving nod. "Amazing news then, let me have it!" says Milo. A fraud risk department colleague was initially reluctant, as knowledge of prior frauds, fraud preventive measures, processes, and controls is shared strictly on a need-to-know basis. This information is kept only within the fraud risk department, but after checking with relevant superiors, he provided Milo with an Excel sheet of fraud cases for the last six months.
Baseline data
Milo is hyped as he seems to move quickly ahead with his task, but when he opens the sheet, he realizes it might not be as smooth as he expected. The Excel sheet does have interesting information like the loss amount, the amount recovered, the date of the incident, the source of the incident, customer ID, and a few other details. But Milo is missing the most important information for him – the actual transaction ID so he can match and flag the transactions in his dataset that were identified as fraudulent. On the other hand, the good news was that the Excel sheet contained at least some transaction details linked to the fraud cases. Milo checked again with his colleagues to see whether they had data where actual transaction IDs were assigned to the frauds, but again, no luck. Since having the flags is the only way to move forward with building the predictive model, he decided to review the Excel sheet and manually match and flag the fraudulent transactions in his dataset. It did take him some time to go through all six months of fraud cases and flag the transactions, as there were a few hundred of them. But at last, the ABT was ready.
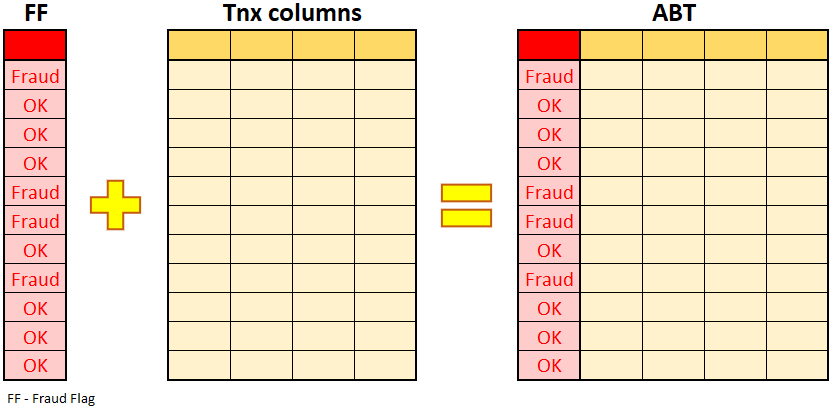
Milo opened his analytical toolset to run the first test and develop a predictive analytical model. He had transactions with a few hundred fraud cases tagged, so this should be pretty straightforward. Next, Milo split the ABT into two datasets: training and validation. The training dataset will be used to train the model, and the validation dataset will be used to validate the model's accuracy.
Milo is not a seasoned data scientist, but he already knows that using only transactional data might not be enough to build a robust, stable model. So, he was not surprised when the model selected relevant fields as the "Tnx. Amount" and "Tnx. Type". Of course, the model built around such limited fields had to be somewhat inaccurate. But since building the model is repetitive and requires multiple rounds of adjustments and validations, this was expected as a first step. Milo's next step was to include additional details to complement the transactional data and allow a finer distinction between "good" and "bad" transactions.
Data extension
Milo added customer-related details – "Age", "How long the customer was with the bank", and "Segment to which the customer belonged". So now every transaction in the ABT has these extra columns populated based on the linked customer. After adding these details, he retrained the model again and saw that the model seemed to consider age as a relevant indicator – it appeared that older customers were slightly more common among the victims of the fraud.
In the next round, Milo added further details – now he added points related to the accounts and products – what products customers had – cards, loans, savings accounts. All of these details were appended to each transaction within ABT. Milo retrained the model again, and it seemed that customers with loans were slightly more likely to be targeted as fraud victims. But the overall accuracy of the model was improving only very little.
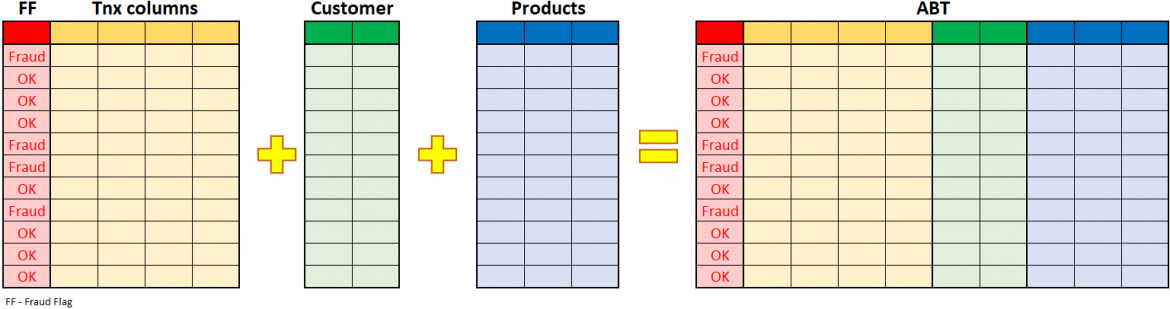
Milo amended the ABT with information from many other DWH tables, yet the model's accuracy wasn't very high. Nevertheless, he felt a bit stuck, so he told his fraud-risk colleagues what he had learned so far. His colleagues confirmed his findings around elderly people and people with loans, and added a vital detail: customers with loans flagged in the provided Excel were mainly linked to "application fraud," which was mostly 1st-party fraud. So they were not victims but rather perpetrators.
Narrowing the focus
This was exciting information as Milo had seen some fraud classification details in the Excel sheet, but he didn't consider it relevant at the time. Now he remembered that Excel included different fraud typologies with very different meanings and, logically, very different fraud patterns. He realized he was trying to build a model that would capture different fraud typologies. Now he understood why his model's accuracy didn't meet his expectations.
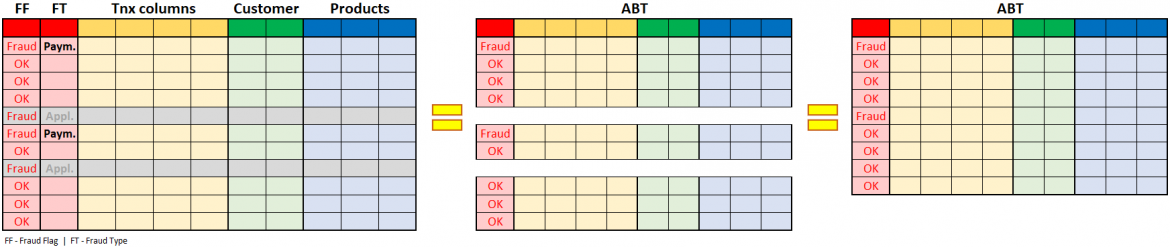
Unfortunately, this meant that he had to go through Excel again and not only flag the transactions as fraudulent or not, but also amend the data with the fraud typology column to distinguish between different fraud types. After doing this, he decided to focus only on payment fraud and ignore all the other typologies to make his model more focused and accurate. He also realized that the pool of fraudulent transactions decreased substantially: from hundreds of fraudulent transactions, he was down to slightly more than a hundred. Fewer frauds in the population often result in lower predictive-model accuracy. More fraudulent transactions are better, so the model can spot different variants of "bad" transactions.
After re-training the model on the new ABT, his model's accuracy improved (even though having a loan wasn't a relevant indicator of fraud anymore). However, it still wasn't good enough as with the current False-Positive Ratio (FPR); the model would create a lot of friction and result in many customer complaints.
Will Milo create the final model now? Are there any further actions that could improve the model?
To Be Continued ...
Disclaimer: The story, all names, characters, and incidents portrayed in this article are fictitious. No identification with actual persons (living or deceased), places, buildings, and products is intended or should be inferred.