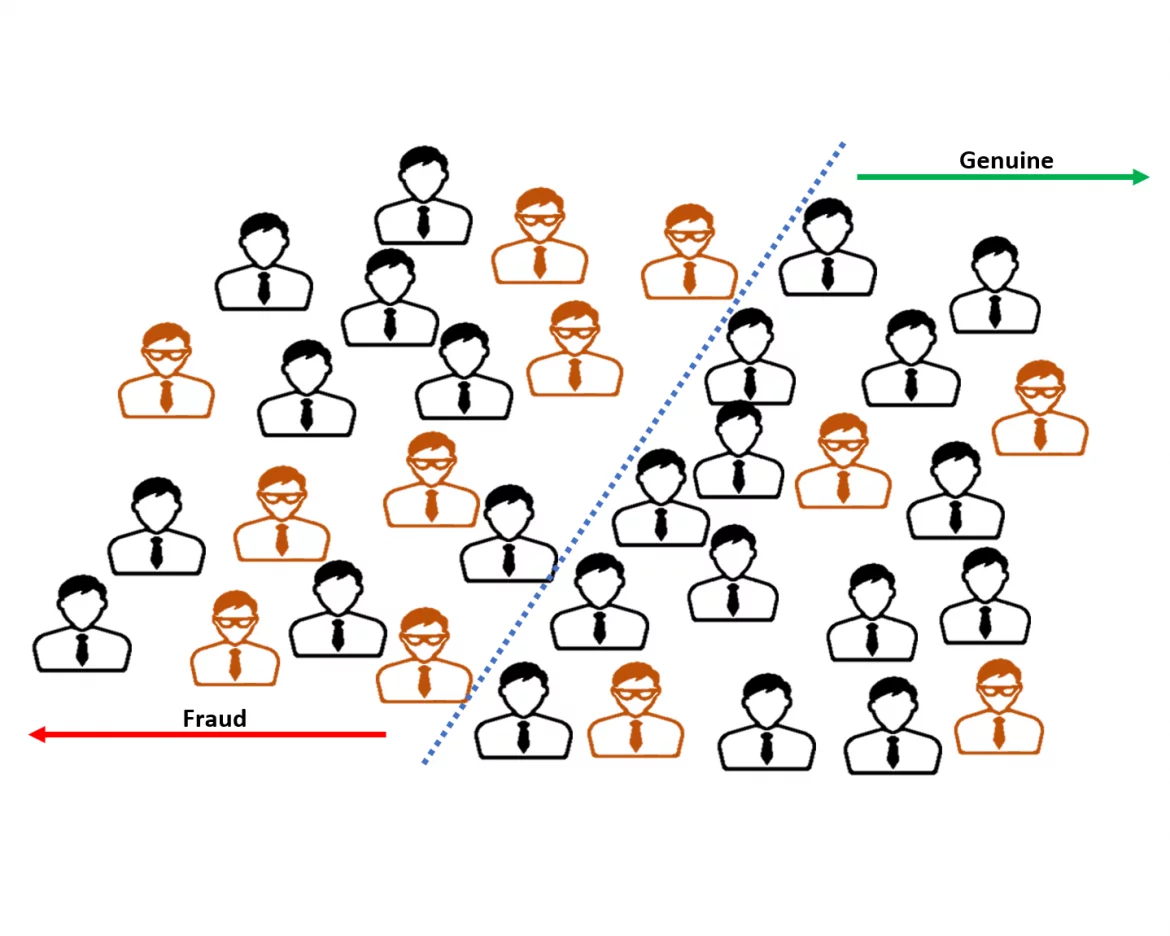
Confusion matrix and the False-Positive Ratio mantra.
A practical guide to the confusion matrix, precision, recall, false positives and balanced accuracy, showing why fraud detection should never be judged by a single metric.
 By Ivan Skula
April 18, 2023
By Ivan Skula
April 18, 2023
What is a confusion matrix?
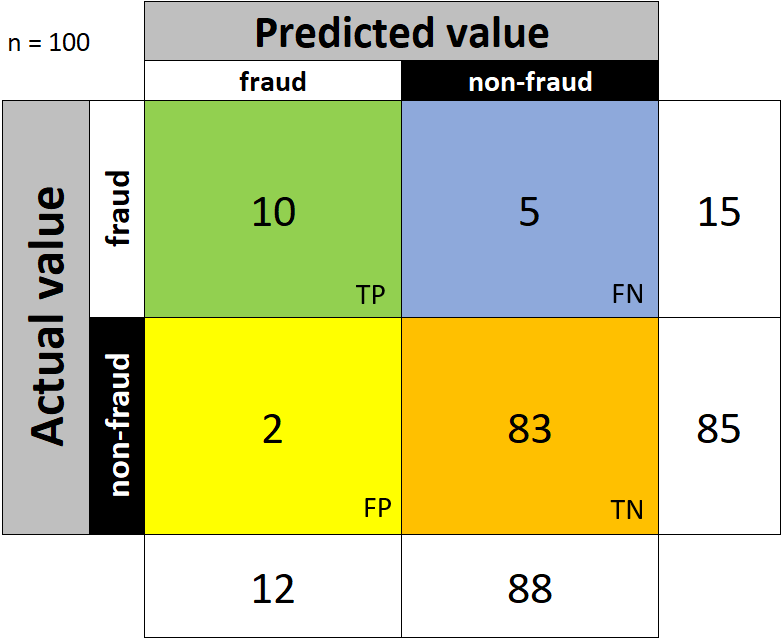
A confusion matrix, or an error matrix, is a table describing the performance of a classification (classification can be performed via expert rules - single or multiple or a predictive model). For our fraud-related use case, a binary classifier (fraud/non-fraud) is sufficient.
Each row of the table represents an instance in the actual class
- fraud in case the transaction, in reality, is fraudulent
- non-fraud in case the transaction, in reality, is not fraudulent
Each column of the table represents an instance in the predicted class
- fraud in case the fraud detection system flagged the transaction as fraudulent irrespective of whether in reality it is or it is not
- non-fraud in case the transaction is flagged by a fraud detection system as non-fraudulent irrespective of the reality
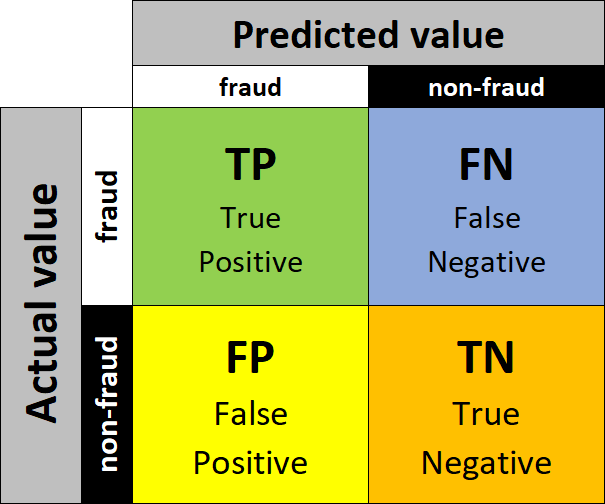
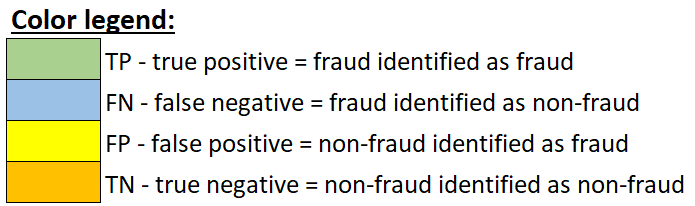
From the above description and the diagram, we see that four outcomes can be reached:
Imagine a dataset of 100 customers, with fraudsters among genuine customers. Using our preferred detection technique, we classify all customers as fraudsters (all pink highlighted) or genuine customers (all blue highlighted).
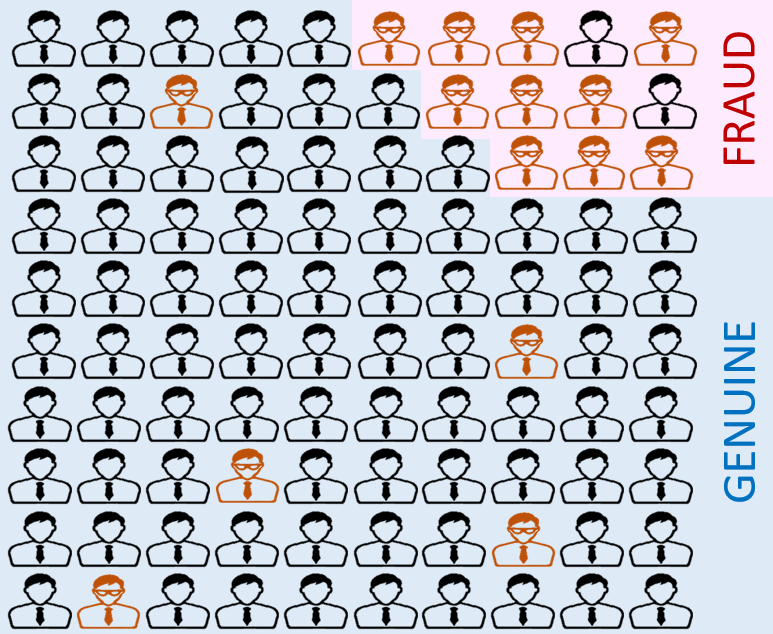
From the picture, it is clear that our technique is not 100% accurate, as we can see genuine customers among the assumed fraudsters and fraudsters among the classified genuine customers. The picture below shows that actual fraudsters are classified as True Positives (green) when we correctly identify them as fraudsters. The fraudsters we missed are called False Negatives (blue), and we try to improve our detection technique to identify them as fraudsters next time.
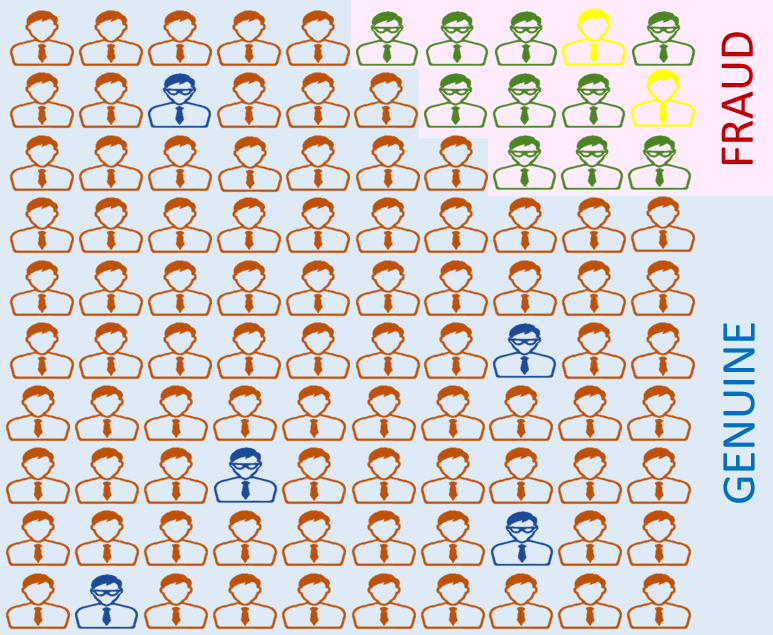
Now we are left with genuine customers; if we correctly classify them as genuine, those are True Negatives (orange-colored). On the other hand, those genuine customers we classified as fraudsters - those are (famously known) as False Positives (yellow-colored), and because of our incorrect classification, we might have annoyed them despite them being good customers - so this is the extremely important group/figure many fraud experts are trying to minimize.
So, what is it good for?
The confusion matrix will allow us to review the most important KPIs - measuring the efficacy of a rule, analytical model, or even overall fraud detection system. Let's use the sample above: 100 customers, 15 fraudsters, and 85 genuine (non-fraudulent). Now our confusion matrix would look like this:
The most common metrics
Now we will go through the most common metrics that are used to describe the efficiency of fraud detection:
True Positive Rate
(TPR, also known as Sensitivity, Recall, or Hit rate; higher is better) - measures how often the system flags actual fraudulent occurrences as fraud

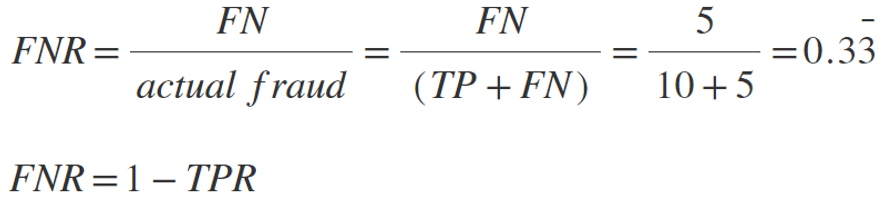
False Negative Rate
(FNR, also known as miss rate; lower is better) measures how often the system misses fraud among fraudulent occurrences
False Positive Rate
(FPR also known as fall-out, lower is better) - measures how often the system flags an occurrence as fraudulent though it is not

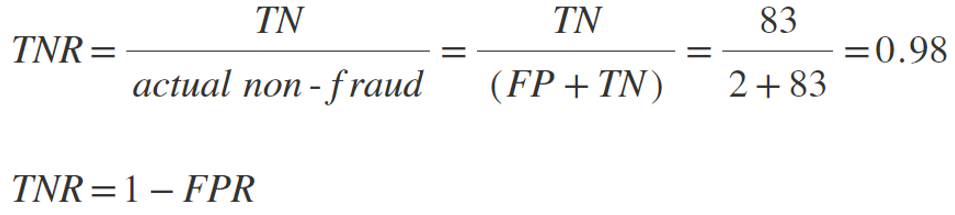
True Negative Rate
(TNR, also known as specificity or selectivity; higher is better) measures how often the system classifies non-fraud as non-fraud
Accuracy
(ACC, higher is better) describes how often the system flags a fraudulent occurrence as fraud and as non-fraud when it is not a fraudulent event

- This measure performs quite poorly with unbalanced data like our use-case – fraud detection. Because fraud is very scarce (almost always below 1% of observations), actual frauds are very few compared to non-frauds. Because of this, especially when fraud-detection rules focus on predicting only those few frauds and categorize most transactions as non-fraud, this metric can still show very high accuracy.
- Imagine changing TP in our example above to 1 (instead of 10), which would mean our rule predicts only 1 of the 15 actual frauds. The accuracy measure would be ACC=(1+83)/100 = 0.84, which is very high and therefore misleadingly suggests the rule is performing well.
- To address this performance issue, a good alternative is to use Balanced Accuracy instead (bACC, higher is better), which uses the following formula:
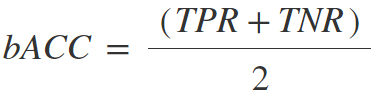
For our adjusted example from above (only 1 TP instead of 10), we would be able to calculate the Balanced Accuracy and see that lower TPR significantly pulls down the overall score:
- TPR = TP/(TP+FN) = 1/(1+14) = 0.06
- TNR = TN/(TN+FP) = 83/(83+2) = 0.98
- bACC = (TPR+TNR)/2 = (0.06+0.98)/2 = 0.52
Positive Predictive Value
(PPV, also known as Precision; higher is better) describes how often the system correctly flags an occurrence as fraudulent.

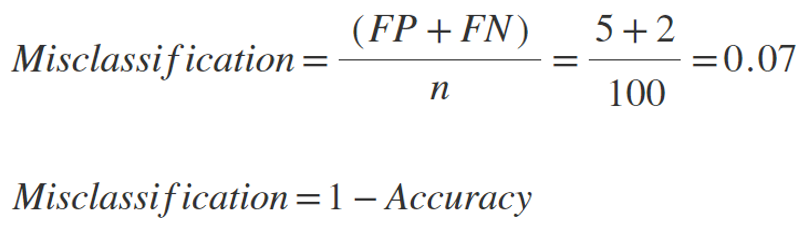
Misclassification rate
(lower is better) shows how often the fraud detection system is wrong (considers only wrongly classified frauds and wrongly classified non-frauds).
F1-Score
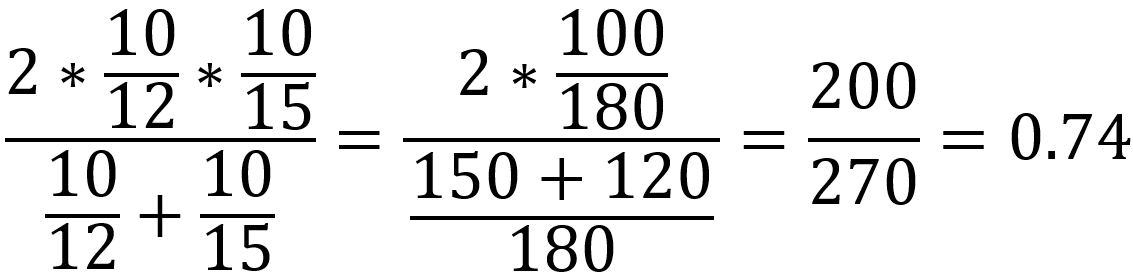
(higher is better) is a measure combining precision (PPV) along with the True Positive Rate (TPR) and is commonly described as a harmonic (harmonic because the ratio between the weight of PPV and TPR is equal to 1:1) mean between these two measures. This is also a valuable metric because it is very sensitive when precision or recall is very low and similar to balanced accuracy, considering multiple characteristics simultaneously.

So, how critical is the False-Positive Ratio?
Sometimes this extreme focus on the False-Positive Ratio comes from the above-mentioned impact - genuine customers misclassified as fraudsters and the practical operational impact on the staff performing alert review and resolution within the organization. Observed false positives are very tangible for the staff interacting with genuine customers. A repetitive negative experience can quickly decrease trust in the fraud system. This also becomes a severe internal inconvenience for staff, especially when they need to contact alerted customers, and many of their calls result in a false positive/false alert.
This becomes even more tangible when investigation resources or call center agents do not report directly to the fraud business unit. Depending on the organization's size and practices, these resources might fill more than one role, and in addition to their responsibilities as fraud alert resolution agents, they could also serve as customer service center agents.
Nevertheless, the danger is that, for the fraud business unit, FPR becomes the single metric by which efficacy is measured and, in an attempt to mitigate the risk of issues being raised by the call center manager or other business unit owning this part of the process.
As shown above, FPR is important, but it is only one metric describing specific characteristics of the system. If we focus solely on FPR, we can easily reach whatever threshold we feel is satisfactory by making the rule (s) stricter or more focused.
For example, let's have a rule that alerts on the first transactions of cards issued within the last seven days, initiated from high-risk countries. FPR is, for example, 30% (30 out of 100 non-frauds are flagged as fraud). We analyzed recent frauds and observed that 70% of fraudulent transactions are above 100 EUR, and around 50% are above 250 EUR. To reduce FPR, we decided to make the rule more focused and add another condition so we alert only on transactions greater than 100 EUR. This adjustment might lower the FPR to, say, 20%. To further reduce FPR, we can increase the threshold to 250 EUR and reduce FPR to 9%, which may be below our acceptable threshold of 10%.
From the example above, this approach will reduce FPR but might affect other important metrics, like True Positive Rate. So, although we get very few false positives with the given rule, we might also miss more actual fraud than before with more relaxed conditions.
Now we come to the point where we see that focusing on only one of the above metrics is not the best approach. We should look at multiple metrics when trying to reduce FPR, or choose a metric that combines the above-mentioned rates (e.g., Balanced Accuracy or F1-score).
Any fine-tuning effort to address the high FPR of a particular rule should remember that other measures may be equally, if not more, important to keep the system's fraud-detection capability balanced and at the highest possible level. Also, it is extremely important to use meaningful-sized datasets when validating the efficacy and to remember the nature of the fraud, where the ratio of frauds vs. no-frauds is heavily imbalanced in favor of genuine transactions, which will affect certain metrics.